The Broken Physics of Remediation: Why Houston Businesses Can’t Outpatch Attackers
88% of Weaponized Vulnerabilities Were Patched Slower Than They Were Exploited – The Manual Tax: Why Your Bottom Half Takes 5x Longer Than Your Top Half
The Broken Physics of Remediation: Why Houston Businesses Can't Outpatch Attackers
Qualys analyzed 1 billion remediation records. The verdict: manual patching has hit a hard ceiling - and attackers already know it.
The Qualys Threat Research Unit just published one of the largest studies of enterprise remediation behavior ever conducted - and the numbers should make every Houston business owner rethink their approach to cybersecurity. The report, titled "The Broken Physics of Remediation," draws on more than 1 billion CISA Known Exploited Vulnerabilities (KEV) remediation records spanning 10,000+ organizations from 2022 through 2025.
The core finding is blunt: the traditional "patch race" - the belief that reducing Mean Time to Remediate can outrun attackers - has hit a mathematical ceiling. Attackers are now weaponizing vulnerabilities before patches even exist.
For small and mid-sized businesses across Houston, Katy, Sugar Land, and the broader West Houston corridor, this isn't an abstract enterprise problem. It's an operational reality that demands a different approach to cybersecurity.
CinchOps is a managed IT services provider based in Katy, Texas, serving small and mid-sized businesses across the Houston metro area. CinchOps specializes in cybersecurity, network security, managed IT support, VoIP, and SD-WAN for businesses with 10-200 employees.
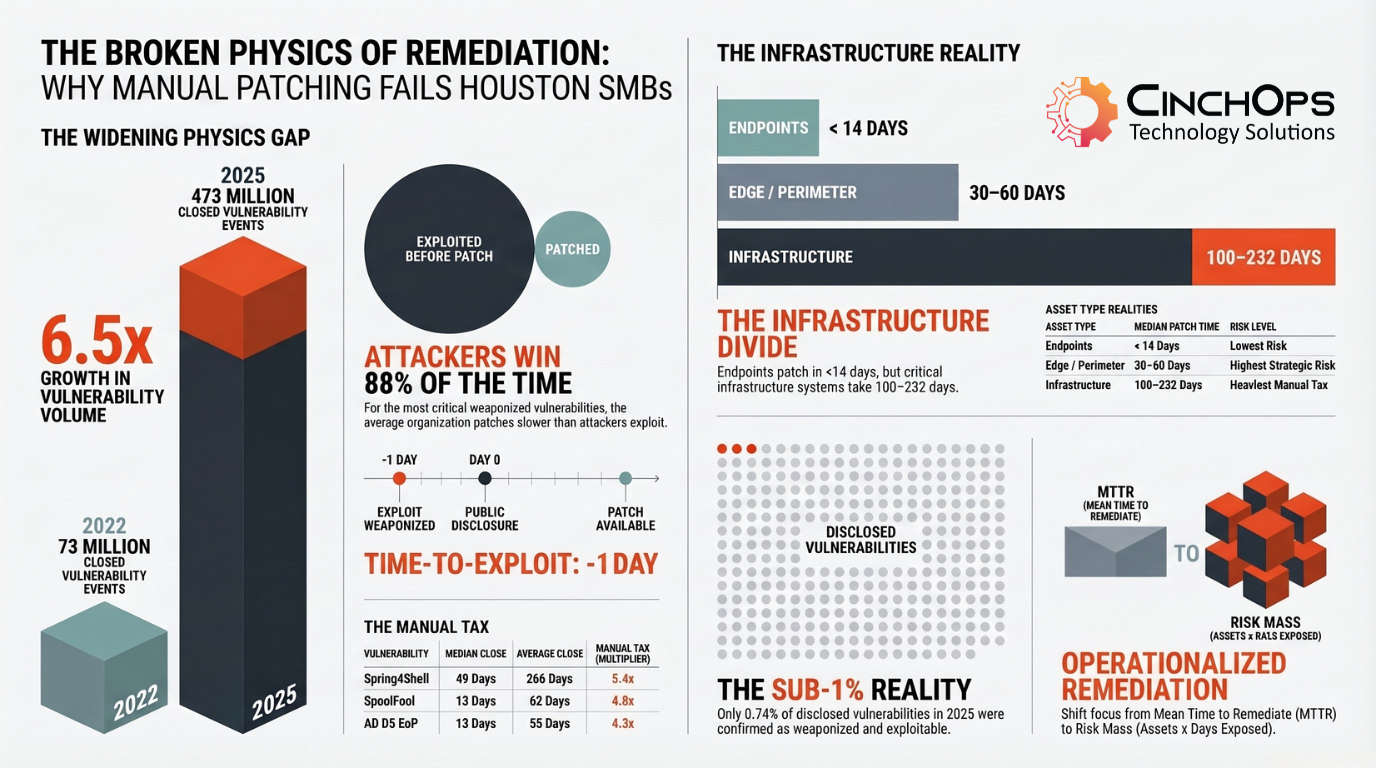
The raw numbers tell a story that's hard to argue with. The volume of closed vulnerability events across the organizations Qualys tracked grew from roughly 73 million in 2022 to 473 million in 2025. That's a 6.5x increase in four years, with a 1.57x jump from 2024 alone.
Here's the part that should concern every Houston business: even controlling for the growth in organizational coverage, the percentage of critical CISA KEV vulnerabilities still open at Day 7 didn't improve. It went the other direction - rising from 56% in 2022 to 63% in 2025.
Teams worked harder. They closed more tickets in absolute terms. But the rate of incoming risk outpaced the rate of remediation. You can't scale a workforce 6.5x to match a 6.5x increase in exploitable risk. And even if you could, the data shows it wouldn't be enough. The constraint isn't effort. It's the operational model itself.
For a 50-person Houston business running a lean IT team (or no dedicated IT team at all), this math is particularly unforgiving. The businesses that are keeping up are the ones with managed IT support handling automated remediation at scale.
Most organizations rely on MTTR - Mean Time to Remediate - as their primary remediation metric. It measures something real: how quickly your team responds once a vulnerability enters the pipeline. The Qualys report makes a persuasive case that MTTR, while useful as an operational efficiency metric, misses the actual risk picture.
MTTR doesn't capture what happened before the first ticket was opened, how long the environment was exposed while remediation was underway, or the compounding risk absorbed by every asset that remained unpatched while the average was being calculated.
Qualys CEO Sumedh Thakar developed a complementary metric called Average Window of Exposure (AWE) to fill this gap. Where MTTR measures how fast teams close tickets, AWE measures the full window from the moment a vulnerability becomes exploitable to the moment it is remediated across the entire environment.
If the attacker arrives on Day 1 and you finish patching on Day 21, your AWE is 21 days. If MTTR told you "8 days," it averaged the fastest closures with the slowest - producing a single number that obscured the fact that a third of your assets were still exposed weeks later.
The survival curve data from 2025 paints a specific picture of how this plays out:
- At the moment of disclosure: 85% of vulnerable assets remain unpatched
- At one week: 63% still open
- At 21 days (the average remediation mark): One in three assets - 33% - is still exposed
- At 90 days: Nearly 12% of the attack surface persists
That long tail is where breaches happen. For Houston businesses running critical infrastructure, the gap between "how fast we responded" and "how long we were exposed" is the gap between a good dashboard number and an actual breach.
Qualys tracked 52 individual CISA KEV vulnerabilities with complete exploitation timelines and confirmed first-exploitation dates. The results are stark.
88% of those vulnerabilities fell above the break-even line - meaning for the vast majority of the most critical, actively exploited vulnerabilities of the past four years, the average organization patched slower than the attacker exploited.
Half of these 52 vulnerabilities - 26 of them - were exploited before the CVE was even publicly disclosed. Three more were exploited on the day of disclosure itself.
The scale of pre-disclosure exploitation is significant. Some examples from the report:
- Windows Kernel EoP (CVE-2024-21338) was exploited 182 days before disclosure
- WinRAR RCE (CVE-2023-38831) was weaponized 110 days before disclosure
- ProxyNotShell (CVE-2022-41040) was exploited 85 days before the advisory
- FortiOS Auth (CVE-2024-55591) was weaponized 60 days before publication
- Follina (CVE-2022-30190) was exploited a full month before disclosure
For each of these, the "Day 0" starting line that remediation programs are built around didn't represent the beginning of the race. It represented the point at which defenders discovered they were already behind.
The Manual Tax is Qualys's term for the gap between median and average remediation time. It's not a flat number - it's a multiplier. For Spring4Shell, the average is 5.4 times the median. For SpoolFool, 4.8 times. The bottom half of the distribution - forgotten servers, remote laptops, shadow IT, assets deferred to the next maintenance window - takes four to five times longer than the organization's best performers.
We see this pattern at least twice a month with Houston businesses we onboard. The first 50% of their tickets look fine on a dashboard. The remaining tail drags actual exposure out by three to nine months.
The report calls it the Manual Tax. We just call it Tuesday. A CPA firm in Sugar Land has the same VPN vulnerability as a Fortune 500 company, but without the 20-person security team to fix it by Friday. That's exactly the gap a managed IT partner is supposed to fill - and this data shows what happens when nobody does.
Is Your Houston Business Exposed?
The Qualys data shows that infrastructure systems - firewalls, VPNs, application servers, backup platforms - take months to patch. For Houston businesses in oil and gas, manufacturing, and law, these are exactly the systems that matter most. CinchOps provides continuous vulnerability management and automated patch deployment for businesses across the Houston metro.
Learn about our cybersecurity services →Risk Mass is a concept the Qualys report introduces to capture what vulnerability counts and MTTR both miss: time. The formula is straightforward. Take the number of vulnerable assets, multiply by the number of days each remains exposed, and you get exposure-days - a single value representing the total window an attacker had to exploit your environment.
A vulnerability affecting 400 assets and closed in one day produces 400 exposure-days. The same vulnerability left open for 100 days produces 40,000. Standard CVE counts treat these as the same event. Risk Mass reveals them as completely different risk postures.
The report traces the Follina vulnerability (CVE-2022-30190) through three phases to show how Risk Mass works in practice. Follina is a remote code execution vulnerability in the Microsoft Support Diagnostic Tool that affected over 6,000 organizations in Qualys's dataset. The average organization carried roughly 400 vulnerable assets.
- The Blind Spot (Day -30 to Day 0): ~12,000 exposure-days. Follina was weaponized 30 days before public disclosure. All 400 assets were vulnerable, no patch existed, and no remediation ticket could be created. This phase accounted for 36% of total Risk Mass.
- The Sprint (Day 0 to Day 23): ~6,200 exposure-days. Remediation began at disclosure. By Day 7, roughly 79% of assets remained unpatched. This phase accounted for 19% of total Risk Mass - the phase that shows up on dashboards.
- The Long Tail (Day 23 to Day 364+): ~14,600 exposure-days. After the median organization finished patching, 170 assets remained open. At one year, 15 assets were still vulnerable. This phase accounted for 44% of total Risk Mass.
The dashboard measures the sprint. Risk Mass measures everything the sprint misses. For Follina, 80% of cumulative exposure came from the Blind Spot and the Long Tail combined. The sprint - the part that appears in compliance reports - accounted for less than 20%.
The dashboard measures the sprint. Risk Mass measures everything the sprint misses.
Here's the flipside of the bad news: the operational universe that demands urgent action is a tiny fraction of total disclosure volume.
In 2025, the industry disclosed 48,172 new vulnerabilities. Of those, Qualys threat intelligence confirms that 357 - just 0.74% - were remotely exploitable, actively weaponized in the wild, and supported by working proof-of-concept code. This sub-1% pattern has held steady even as total disclosure volume nearly doubled:
This doesn't mean the other 99% are irrelevant - compliance requirements, defense-in-depth, and future exploitation risk all matter. But it defines the tier where speed of response is existential. The challenge is no longer identifying which vulnerabilities are dangerous. It's confirming which ones within that small fraction are actually exploitable in your specific environment - and acting on that confirmation before the window closes.
The report identifies what it calls "environment-adjusted exploitability" - the gap between what's theoretically dangerous and what's confirmed exploitable given an organization's deployed compensating controls. A vulnerability scored as critical may be mitigated in practice by a web application firewall blocking the exploit path, a service running in an inactive configuration, or network segmentation isolating the vulnerable asset from attacker-reachable infrastructure.
For Katy-area businesses and companies across Sugar Land, this means the right managed IT partner can dramatically reduce your real-world exposure by focusing remediation resources on the vulnerabilities that are actually exploitable in your environment - not just the ones with high CVSS scores.
The Qualys data is drawn from enterprises, but the physics apply to every business with network-connected systems. A 40-person CPA firm in Sugar Land faces the same Time-to-Exploit of -1 day as a Fortune 500 company. The difference is the CPA firm probably doesn't have a dedicated security team to respond.
The report identifies three distinct remediation realities based on asset type, and each one maps directly to what we see in Houston SMB environments:
- Endpoints patch fastest. Median close times under 14 days, even at high volumes. Automated patching infrastructure works here. The priority for endpoints is extending that speed advantage with pre-disclosure detection capabilities. For most Houston businesses, this is the part that's working - if they have automated patching at all.
- Edge and perimeter devices carry the highest strategic risk. Firewalls, VPNs, gateways - they're internet-facing, they provide direct access to internal networks, and the majority in the Qualys dataset were exploited before disclosure. You can't protect what you can't see. A complete, continuously updated asset inventory is the foundation.
- Infrastructure systems represent the deepest challenge. Middleware, application servers, backup infrastructure, network equipment. Median close times routinely extend into months: Cisco IOS XE at 232 days, F5 AuthBypass at 231 days, WebLogic RCE at 125 days. For Houston engineering firms, construction companies, and wealth management firms running specialized infrastructure, this is where compensating controls become essential.
The report's conclusion is clear: for infrastructure assets where patch cycles are measured in weeks or months, patching alone cannot close the exposure window. Network-level containment, virtual patching, host isolation, traffic blocking, and compensating controls need to fill the space between disclosure and the definitive fix.
How Does Your Houston Business Stack Up?
- We maintain a complete, continuously updated inventory of every network-connected asset in our environment
- We have automated patch deployment covering all endpoints and workstations with defined SLAs
- We know the median and average remediation times for critical vulnerabilities - not just MTTR
- We deploy compensating controls (virtual patching, segmentation) for infrastructure systems with long patch cycles
- Our cybersecurity provider prioritizes remediation based on confirmed exploitability, not just CVSS severity scores
- We track exposure duration for critical vulnerabilities, not just whether they were eventually closed
- We have a defined response plan for zero-day vulnerabilities that are exploited before patches exist
- Edge devices (firewalls, VPNs, gateways) are inventoried separately and have distinct patching timelines
- We review our vulnerability management posture at least quarterly with our IT provider
- We have business continuity plans tested against a ransomware scenario that exploits unpatched infrastructure
The Qualys report puts hard numbers on what we've been telling clients: the traditional approach to patching doesn't work anymore, and hoping your IT vendor "handles it" isn't a strategy.
In 35 years of creating, implementing and supporting IT solutions, the pattern I've seen most often is businesses that don't know they're exposed until something breaks.
A 30-person law firm in Katy isn't thinking about Time-to-Exploit metrics. They're thinking about whether client data is safe and whether their systems will be up Monday morning. The Qualys report proves that the answer depends entirely on whether someone is actually closing those patches in days instead of months - and most firms don't have anyone doing that.
CinchOps delivers the operational model this report calls for - continuous, prioritized, automated remediation - scaled to what Houston SMBs actually need:
- Continuous vulnerability monitoring and asset inventory management that covers endpoints, edge devices, and infrastructure - not just the easy stuff. You can't patch what you don't know about.
- Risk-based patch prioritization focused on the sub-1% of vulnerabilities that represent confirmed, weaponized risk - not wasting cycles on theoretical exposure while real gaps persist.
- Automated patch deployment for endpoints and workstations with defined SLAs, reducing the Manual Tax that drags average remediation times into months.
- Compensating controls and mitigation layers for infrastructure systems where patch cycles require change windows - virtual patching, network segmentation, and traffic blocking to reduce exposure while fixes work through approval processes.
- Business continuity and disaster recovery planning because some vulnerabilities will be exploited before patches exist - and your business needs to survive that scenario.
- Regular security assessments that measure AWE and actual exposure, not just MTTR and ticket counts - so your dashboard reflects your real risk posture.
The organizations in the Qualys dataset that are winning the physics gap aren't winning because they have larger security teams. They're winning because they've operationalized the full remediation lifecycle. That's exactly what CinchOps provides for Houston businesses.
What is the average Time-to-Exploit for critical vulnerabilities in 2024?
According to Google Threat Intelligence Group analysis of 2024 exploitation trends, the average Time-to-Exploit has collapsed to negative one day. This means attackers are weaponizing and exploiting vulnerabilities before a patch is publicly available, making traditional patch-and-respond models structurally inadequate for Houston businesses and organizations worldwide.
What is Risk Mass and why does it matter for cybersecurity in Houston?
Risk Mass measures the total cumulative exposure an organization absorbs from a vulnerability by multiplying the number of vulnerable assets by the number of days each remains unpatched. It is expressed in exposure-days. Unlike Mean Time to Remediate, Risk Mass captures the full duration and breadth of risk, including pre-disclosure blind spots and long-tail remediation delays that traditional metrics hide.
How can a managed IT services provider help with vulnerability remediation?
A managed IT services provider like CinchOps handles continuous vulnerability monitoring, risk-based patch prioritization, and automated remediation for Houston-area businesses. This includes maintaining complete asset inventories, deploying compensating controls when patches require change windows, and ensuring critical vulnerabilities are addressed in days rather than months through operationalized remediation workflows.
Why do infrastructure systems take so much longer to patch than endpoints?
Infrastructure systems like firewalls, VPNs, application servers, and backup platforms carry heavy change-window constraints, downtime requirements, and manual update processes. The Qualys data shows endpoint median patch times under 14 days, while infrastructure medians routinely extend to 100-230 days. This gap requires compensating controls like virtual patching and network segmentation to reduce exposure while definitive fixes work through approval cycles.
What percentage of disclosed vulnerabilities are actually exploited in the wild?
Less than one percent. In 2025, out of 48,172 newly disclosed vulnerabilities, only 357 were confirmed as remotely exploitable, actively weaponized, and supported by working proof-of-concept code. The CISA Known Exploited Vulnerabilities catalog contains 1,517 entries out of over 315,000 total published CVEs. Risk-based prioritization helps businesses focus remediation resources on the fraction that represents confirmed, weaponized risk.
Discover More
Sources
Resource