


Data Breach Cost by Industry: 2024 to 2026 Trends
A Sector By Sector View Of IBM’s 2026 Findings – What Changed For Energy, Industrial And Financial Services
So What Happened to Last Year's Decline?
Every industry IBM tracks, across three editions, and what the trend actually means for Houston small and mid-sized businesses.
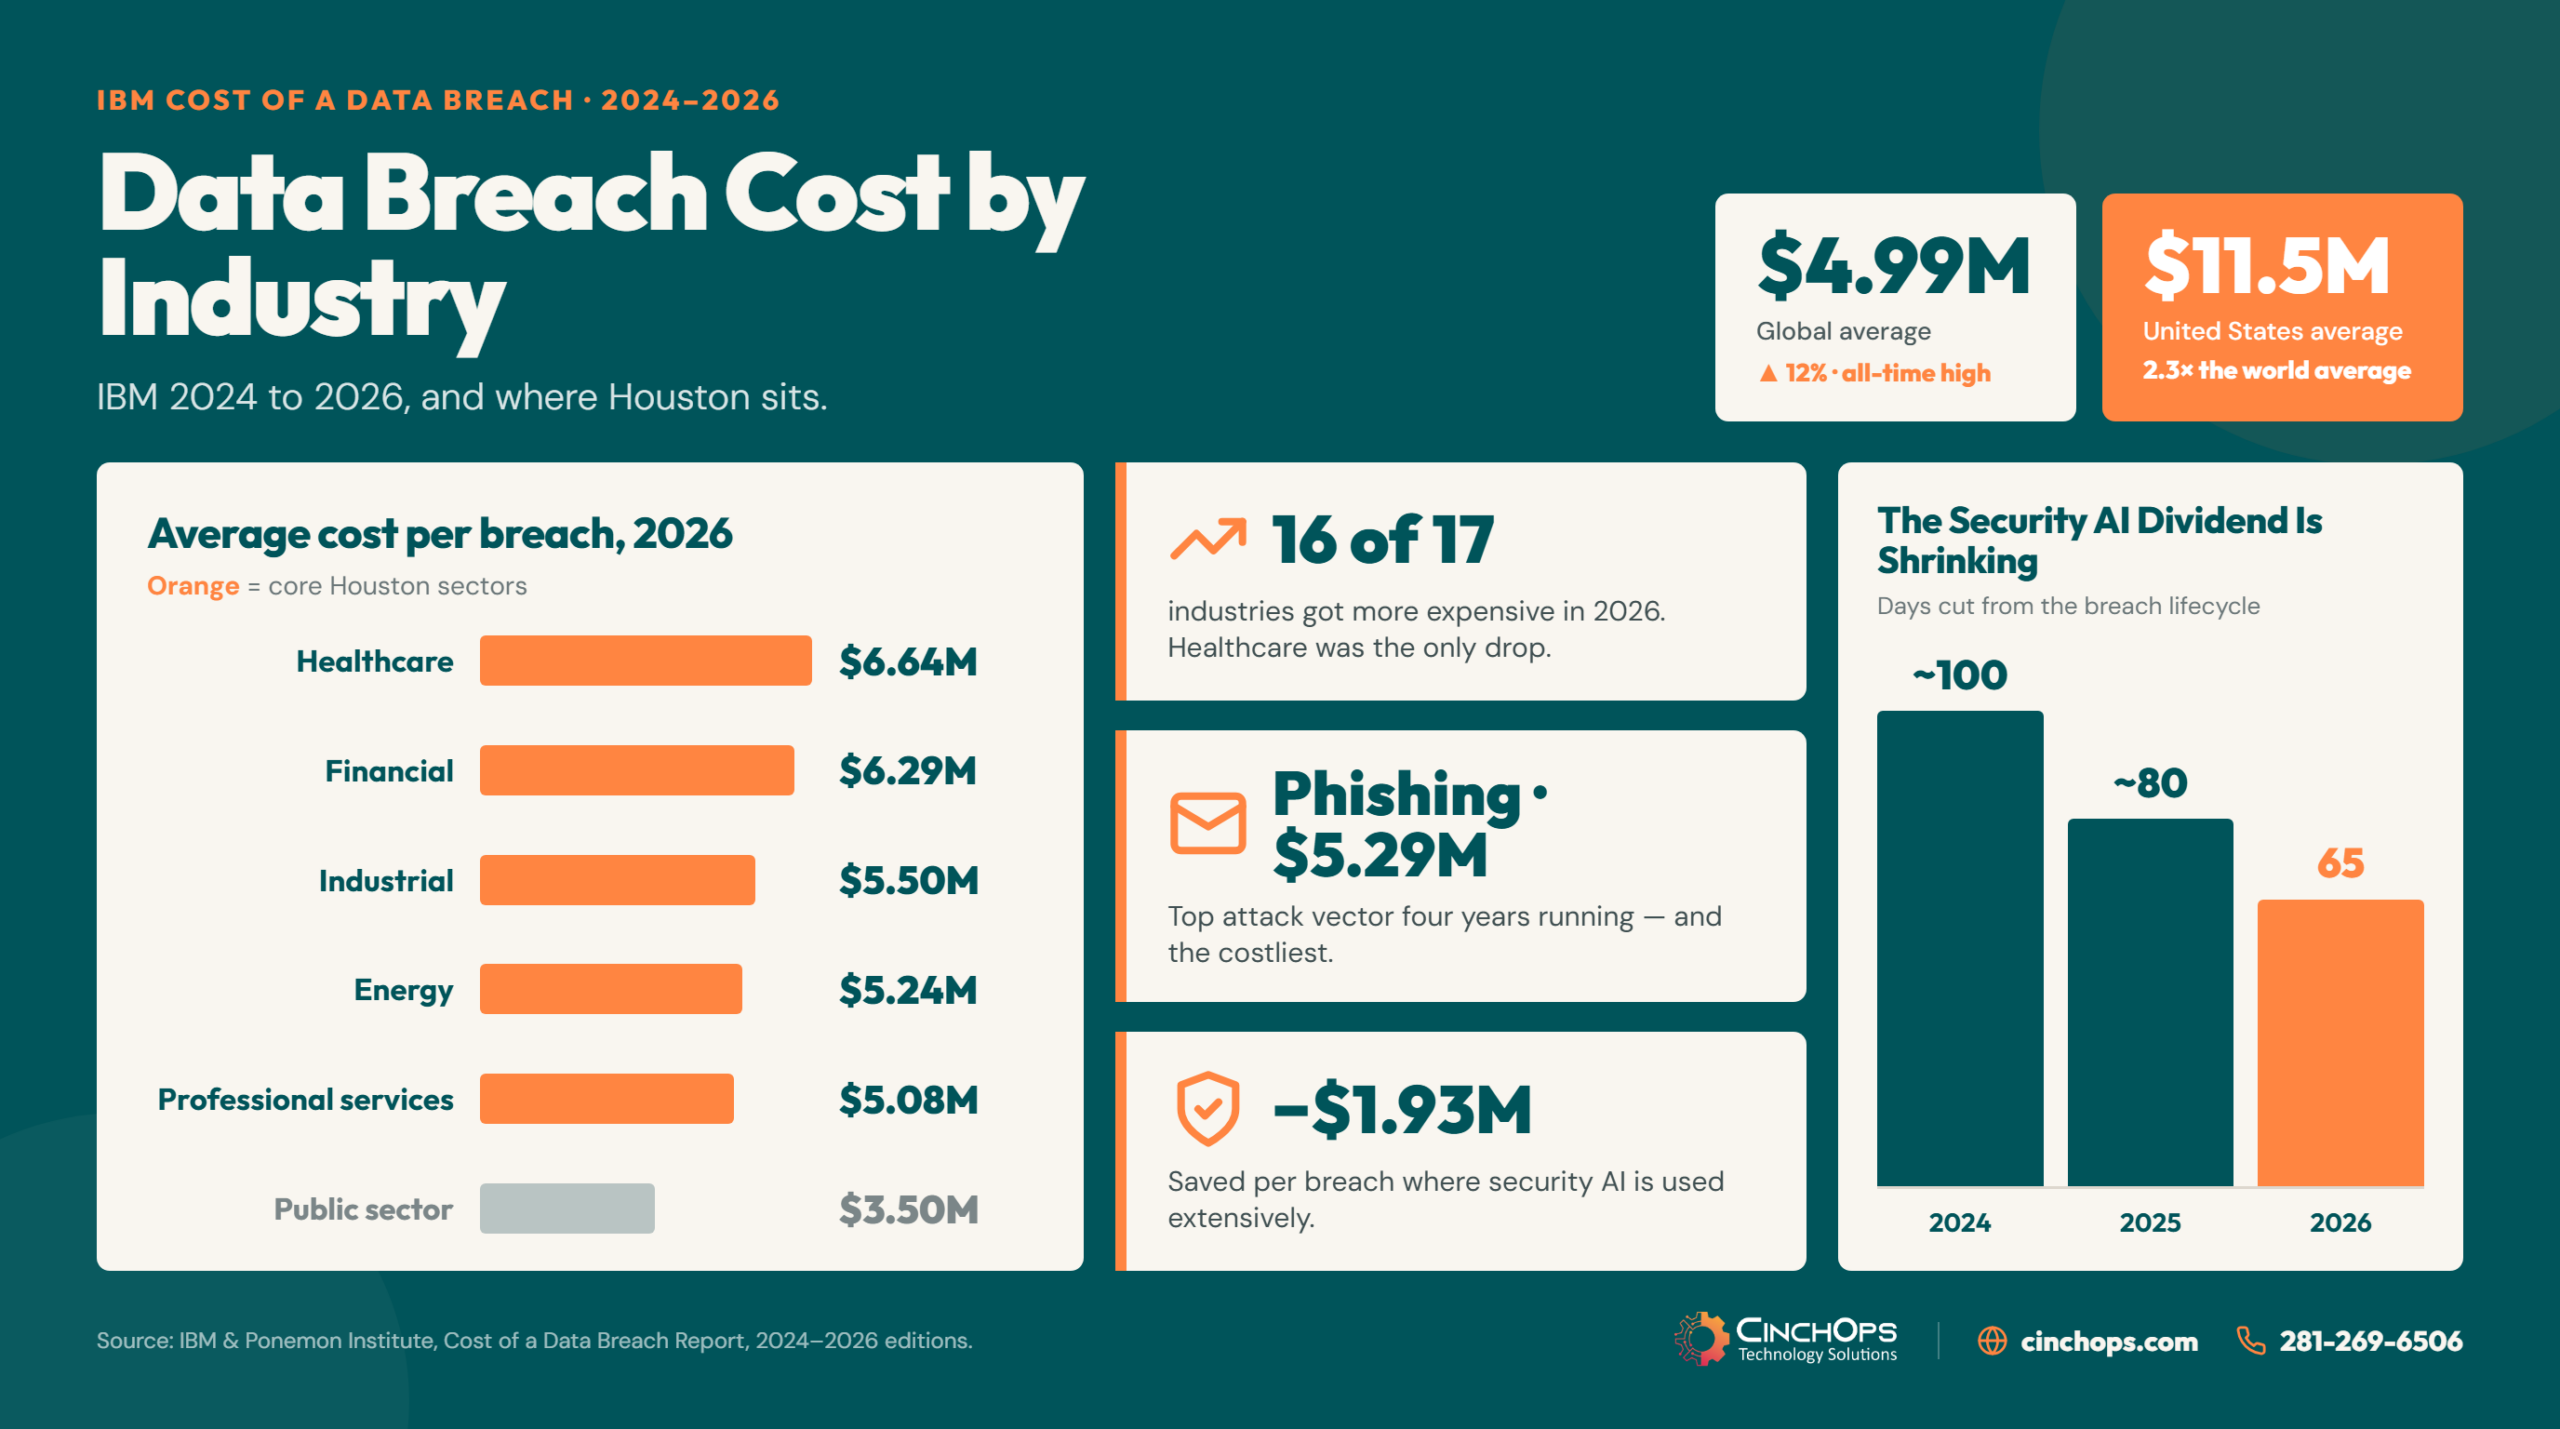
Data breach cost by industry ranged from USD 6.64 million in healthcare down to USD 3.50 million in the public sector in IBM's 2026 report, and 16 of the 17 tracked industries were more expensive to breach than they were a year earlier.
The global average behind those industry figures was USD 4.99 million, a 12% increase over last year and the highest in the 21 years IBM and Ponemon Institute have run the study. In the United States it hit USD 11.5 million. CinchOps has covered this report three years running, and this is the first time the three-year picture tells a different story than any single edition does. The 2024 report called USD 4.88 million a record. The 2025 report showed the first drop since 2019, down to USD 4.44 million, and a lot of coverage treated that as security teams finally getting ahead. The 2026 edition wiped out that drop and then some. CinchOps delivers managed detection and response specifically for small and mid-sized businesses across the Houston metro, at a flat monthly rate per user, with help desk response under 15 minutes.
What Do IBM's 2024, 2025 and 2026 Reports Show Side by Side?
Seven headline metrics from three consecutive editions of the same study, in one table.
| Metric | 2024 report | 2025 report | 2026 report |
|---|---|---|---|
| Global average breach cost | USD 4.88M | USD 4.44M | USD 4.99M |
| Change over prior year | Up 10% | Down 9% | Up 12% |
| US average breach cost | USD 9.36M | USD 10.22M | USD 11.50M |
| Healthcare, costliest industry | USD 9.77M | USD 7.42M | USD 6.64M |
| Mean days to identify and contain | 258 | 241 | 247 |
| Savings from extensive security AI | USD 2.2M | About USD 1.9M | USD 1.93M |
| Days saved by extensive security AI | About 100 | About 80 | 65 |
Two lines in that table move in opposite directions, and that contradiction is the real finding: the money security AI saves has held roughly flat for three years while the time it buys has fallen by about a third.
The 2024 and 2025 columns come from CinchOps' coverage of those editions at the time, which you can read in the 2024 report breakdown and the 2025 report breakdown. The 2026 column comes from the report published this year, which studied 602 organizations across 16 countries and 17 industries, with breaches ranging from 2,590 to 115,380 compromised records.
Healthcare is the outlier worth naming. It has now been the costliest industry for 13 consecutive years, and it is also the only industry in the 2026 study whose average went down, falling 10.5% to USD 6.64 million. Every other sector rose. Communications jumped 20% to USD 4.71 million and entertainment rose 18% to USD 5.38 million. So healthcare keeps the crown while quietly closing the gap on everyone else.
Is Security AI Still Buying You As Much Time As It Did in 2024?
The dollar savings held. The days saved did not.
Extensive use of security AI and automation saved organizations USD 1.93 million per breach in IBM's 2026 report and cut 65 days off the breach lifecycle, down from roughly 100 days in the 2024 edition and 80 days in 2025.
In the 2026 study, organizations using security AI and automation extensively averaged USD 4.00 million per breach against USD 5.93 million for those that used none. They resolved breaches in 215 days versus 280. Both figures are good. What has changed is that the same tooling used to move the needle by a third of a year and now moves it by about two months, because attackers picked up the same speed.
Adoption barely moved either. Extensive users went from 32% of studied organizations in 2025 to 36% in 2026. Nearly two thirds still use these tools in a limited way or not at all. And where they do use them matters more than the report gets credit for.
- Prevention is the weak spot. Combined limited and extensive use of security AI reached 79% in detection and 77% in investigation, but only 69% in prevention. More than a third of organizations are not using it on the front end at all.
- AI agents follow the same pattern. Half of breached organizations run AI agents in a security operations center. Of those, 56% point them at threat hunting and 54% at automated response, but only 18% at vulnerability scanning and management.
- That gap is the one attackers are aiming at. IBM's own opener describes an April 2026 frontier model that found thousands of high-severity vulnerabilities across every major operating system and browser. Vulnerability management is exactly where 18% adoption is not enough.
- Organizations noticed, late. After learning about frontier AI capabilities, 74% said they had rethought where they deploy agents, and planned vulnerability-scan deployment jumped from 18% to 37%. Planned spending increases went from 64% to 85%.
In 35+ years doing this, I have watched a lot of budget get spent on the part of the problem that is easiest to demo. Detection dashboards demo well. Patch cadence does not. The 2026 report is the first one that puts a number on what that preference costs.
Everybody reads this report for the big dollar figure. The number that should worry you is 65. That is the days security AI saved you this year, and it was 100 two years ago. The tools did not get worse. The bad actors got faster.
What Was the Data Breach Cost by Industry from 2024 to 2026?
Every industry IBM tracks, across three consecutive editions, sorted by 2026 cost.
Across IBM's 2024, 2025 and 2026 reports, 13 of the 17 tracked industries ended up more expensive to breach than they were two years earlier, three ended up cheaper and one landed exactly where it started.
Most coverage of this report quotes healthcare and stops. That hides the more useful pattern, which only appears when you line up all 17 sectors across all three editions. The 2024 and 2025 columns below come from Figure 3 of the 2025 report, the 2025 and 2026 columns from Figure 3 of the 2026 report. The two editions state identical 2025 figures for all 17 industries, so the three-year series is internally consistent.
| Industry | 2024 | 2025 | 2026 | Change 2024 to 2026 |
|---|---|---|---|---|
| Healthcare | USD 9.77M | USD 7.42M | USD 6.64M | Down 32.0% |
| Financial | USD 6.08M | USD 5.56M | USD 6.29M | Up 3.5% |
| Industrial | USD 5.56M | USD 5.00M | USD 5.50M | Down 1.1% |
| Technology | USD 5.45M | USD 4.79M | USD 5.50M | Up 0.9% |
| Entertainment | USD 4.09M | USD 4.43M | USD 5.38M | Up 31.5% |
| Pharmaceuticals | USD 5.10M | USD 4.61M | USD 5.25M | Up 2.9% |
| Energy | USD 5.29M | USD 4.83M | USD 5.24M | Down 0.9% |
| Services | USD 5.08M | USD 4.56M | USD 5.08M | No change |
| Communications | USD 4.09M | USD 3.75M | USD 4.71M | Up 15.2% |
| Transportation | USD 4.43M | USD 3.98M | USD 4.50M | Up 1.6% |
| Media | USD 3.94M | USD 4.22M | USD 4.49M | Up 14.0% |
| Hospitality | USD 3.82M | USD 4.03M | USD 4.33M | Up 13.4% |
| Consumer | USD 3.91M | USD 3.72M | USD 4.31M | Up 10.2% |
| Education | USD 3.50M | USD 3.80M | USD 4.15M | Up 18.6% |
| Research | USD 3.54M | USD 3.79M | USD 3.99M | Up 12.7% |
| Retail | USD 3.48M | USD 3.54M | USD 3.80M | Up 9.2% |
| Public | USD 2.55M | USD 2.86M | USD 3.50M | Up 37.3% |
Three things fall out of that table that no single edition tells you.
- The rebound was close to universal. 16 of 17 industries rose between 2025 and 2026. Healthcare was the only one that fell, and it fell for the third year running.
- The 2025 improvement skipped seven industries entirely. While the global average fell 9% that year, entertainment, media, hospitality, education, research, retail and public sector all got more expensive. For those sectors there was never a good year to point back to.
- The gap between costliest and cheapest is collapsing. Public sector rose 37.3% over three years and entertainment 31.5%, both from the bottom of the table. Education is up 18.6%, communications 15.2%, media 14.0%. The spread between the costliest and cheapest industry has narrowed from USD 7.22 million in 2024 to USD 3.14 million in 2026.
The Houston read on that table is specific. Energy is down 0.9% over three years, industrial down 1.1%, services flat, transportation up 1.6% and financial up 3.5%. Those five sectors carry most of the Houston metro economy, and all five dipped in 2025 and climbed back to roughly where they started. A Houston operator reading the headline "up 12% globally" is mostly reading somebody else's increase. Your sector's number went down and came back, which is a harder problem to sell a budget against than a clean upward line.
What Changed in 2026 That Should Change a Houston Business's Plan?
Four findings in the 2026 edition that land differently on the Gulf Coast than they do nationally.
IBM's 2026 report found that 62% of AI-driven attacks hit critical infrastructure sectors, with financial services and energy the two most targeted, which puts the Houston metro near the middle of the concentration rather than at the edge of it.
Energy breaches averaged USD 5.24 million and financial services USD 6.29 million, both above the USD 4.99 million global figure. Houston is an energy town with a financial services layer bolted to it, and the small and mid-sized firms in that supply chain are not separate from the target set. They are the soft edge of it. A 30-person engineering firm that reviews well data for an operator sits inside the same trust chain as the operator.
- Phishing stayed the top way in for a fourth straight year. Voice and SMS phishing accounted for 17% of attacks and produced the costliest breaches at USD 5.29 million. Help desk impersonation and other social engineering added another 13% at USD 5.23 million.
- Ransomware changed what it threatens. Ransomware hit 39% of breached organizations, up from 34%, and 41% of those incidents included threats of public shaming and leaking to the media. Encrypting operational systems was only 23%. The pressure moved from your servers to your reputation.
- Shadow AI more than doubled. Unapproved employee AI use was involved in 43% of AI-related incidents, up from 20%, at an average of USD 5.39 million. About one in five of those incidents drew a regulatory fine.
- Half of breached organizations had no encryption. 53% had not encrypted sensitive data at rest and in motion when they were breached, and another 10% did not know.
One finding is directly relevant to how a Houston business chooses IT support. Breaches found by a managed security service provider averaged USD 4.86 million, the lowest of any discovery route in the study, and were contained in 230 days against the 247-day global average. Breaches the attacker disclosed to you cost USD 5.12 million. That is a USD 260,000 spread on the same incident based purely on who noticed first.
Who Would Notice a Breach in Your Business First?
IBM's 2026 report priced that answer at roughly USD 260,000. CinchOps provides 24/7 monitoring, detection and response through managed cybersecurity for businesses across Houston, Katy and Sugar Land.
Explore CinchOps cybersecurity →How CinchOps Can Help You Act on the 2026 Findings
CinchOps is a managed IT services provider based in Katy, Texas, serving small and mid-sized businesses across the Houston metro area. CinchOps specializes in cybersecurity, network security, managed IT support, VoIP, and SD-WAN for businesses with 10 to 200 employees.
- Through managed IT support, patching and vulnerability remediation run on a schedule rather than when someone has time, which is the 18% gap the 2026 report flags.
- Through managed cybersecurity, monitoring and response run 24/7 with a flat monthly rate per user and no contracts, hidden fees or cancellation penalties.
- Through business continuity and disaster recovery, backups are geo-redundant outside the Gulf Coast flood zone and restores are tested, not assumed.
- For oil and gas and energy services and utilities clients, IT and OT networks are segmented so a phished front-office account does not reach SCADA.
- For CPA practices and law firms, access controls cover the platforms the data actually lives in, from CCH Axcess and UltraTax to iManage and NetDocuments.
- Across Houston, Katy, Sugar Land and Cypress, help desk response runs under 15 minutes and every engagement carries a 30-day satisfaction guarantee.
Do not read the USD 4.99 million average and assume it is a number for companies bigger than yours. The study's smallest breaches involved 2,590 records, which is a client list, not a data center. The parts of the 2026 report that apply to a 40-person Houston firm are the boring ones: encrypt the data, control who can log in, patch on a schedule, and make sure someone is watching who is not also doing four other jobs. If you want a second opinion on which of those four you are actually doing, talk to CinchOps.
Frequently Asked Questions
What is the average cost of a data breach by industry in 2026?
IBM's 2026 report puts healthcare highest at USD 6.64 million, then financial services at USD 6.29 million, with industrial and technology tied at USD 5.50 million. Public sector was lowest at USD 3.50 million. 16 of the 17 tracked industries rose over 2025, and healthcare was the only one that fell.
Did data breach costs go up or down between 2024 and 2026?
Both. IBM's 2024 report recorded USD 4.88 million, the 2025 report showed the first decline since 2019 at USD 4.44 million, and the 2026 report reversed it to USD 4.99 million. Across the same three editions, US costs rose every year, from USD 9.36 million to USD 10.22 million to USD 11.5 million.
What does managed cybersecurity cost in Houston?
CinchOps prices managed cybersecurity at a flat monthly rate per user, so the bill tracks headcount instead of surprising you. There are no contracts, hidden fees or cancellation penalties, and every engagement carries a 30-day satisfaction guarantee. For most Houston small and mid-sized businesses the monthly cost lands well under one hour of the breach cost IBM measured.
Discover More
Resource
Sources
- IBM and Ponemon Institute, Cost of a Data Breach Report 2026
- IBM and Ponemon Institute, Cost of a Data Breach Report 2025
- IBM and Ponemon Institute, Cost of a Data Breach Report 2024
- CinchOps, IBM 2025 Cost of a Data Breach: US Hits Record $10.22M
- CinchOps, IBM 2024 Cost of a Data Breach Report: Key Findings


